
In the fall of 2013 the PA Center for Workforce Information & Analysis at PA Department of Labor & Industry updated the definition of the industry clusters that serve as the basis for data-driven workforce development policies. Here we examine the targeted industry clusters in Philadelphia County.We look how the clusters have changed since 2007, the year before the Great Recession had an impact.
What is an industry cluster?
An industry cluster includes industries closely linked by common products, labor pools, technologies, supplier chains and training needs. They take on strategic importance for long-term economic planning as changes that benefit one industry will generally impact other industries in the same cluster. Clusters play an important part in the work of Industry Partnerships (the regional employer-led collaborative efforts designed to improve the competitiveness of clusters through sharing of training resources) and designation of High Priority Occupations (job categories that are in demand by employers, have higher skill needs and are most likely to provide family-sustaining wages).
How are clusters different from industries?
Industry clusters are comprised of industries that are each assigned a specific six-digit North American Industry Classification System (NAICS) codes. They are mutually exclusive, so that no two clusters contain industries with the same NAICS code. An industry cluster includes industries closely linked by common products, labor pools, technologies, supplier chains and training needs.
Employment and Wages by Industry Cluster
- Overall, the twelve industry clusters account for 76 percent of total employment in Philadelphia.
- Health Care; Education; Business Services; and Hospitality; and Leisure & Entertainment are major clusters in Philadelphia that responsible for more than half of all jobs.
- Several industry clusters in Philadelphia have added jobs since 2007 (period before the Great Recession). In Philadelphia, the Health Care industry cluster grew by 11 percent, jobs in Education increased by 10 percent, and Hospitality, Leisure & Entertainment grew by 8 percent.
- Average earnings in Philadelphia are generally higher than in Pennsylvania, for all clusters except Bio-Medical.
MAJOR CLUSTERS IN PHILADELPHIA AND PENNSYLVANIA
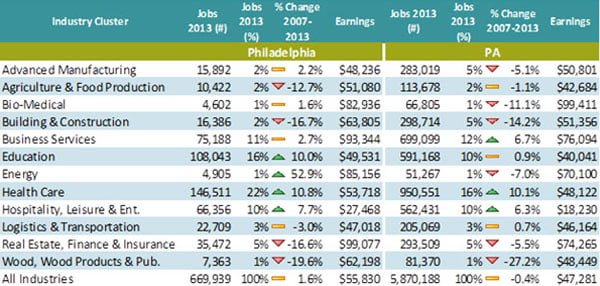
Source: Philadelphia Works analysis of the QCEW Employees & Non-QCEW Employees – EMSI 2013.4 Class of Worker
Industry Clusters in Philadelphia
Worker Demographics & Turnover by Industry Cluster
Workforce demographics are examined by gender, age, and education of workers. Explore demographic characteristics and turnover of workers across the targeted industry clusters in Philadelphia on the interactive chart below.
Gender of Workers by Industry Cluster
Workforce Philadelphia workers are predominantly female – women make up 54 percent of workers across all industries because of their overrepresentation in the largest industry clusters of Health Care and Education. The gender split is somewhat even in the Bio-Medical; Hospitality, Leisure & Entertainment; Business Services; Real Estate, Finance, and Insurance industry clusters.
Men make up a larger share of workers in Advanced Manufacturing; Building & Construction; Energy; and Logistics & Transportation.
Women dominate the Health Care and Education industry clusters.
Age of Workers by Industry Cluster
- Younger workers (14-24 years old) make up 13 percent of total employment. Older workers (55 and over) make up 20 percent of the workers in Philadelphia.
- Hospitality, Leisure & Entertainment and Industries outside of Clusters employed the highest number of younger workers by volume and percent. Advanced Manufacturing, Bio-Medical, and Education clusters employed the largest share of older workers by percentage.
- 25-54 year old adults are distributed across industries similar to all age groups.
Education of Workers by Industry Cluster
- The majority of workers across all industry clusters have a Bachelor’s degree or higher (29 percent) or an Associate’s degree (26 percent).
- Educational attainment varies across industry clusters – workers without a high school diploma and with only a high school diploma made up a large share of the Advanced Manufacturing; Logistics & Transpiration; and Hospitality, Leisure & Entertainment industry clusters. Workers with some college or an Associate’s degree made up a large share of Health Care; Advanced Manufacturing; Logistics & Transportation; and Building & Construction industry jobs. Real Estate, Finance & Insurance; Education; Bio-Medical; and Business Services clusters rely heavily on workers with a Bachelor’s degree or higher.
Worker Turnover by Industry Cluster
- Turnover rates help us evaluate the churning in the labor force – meaning the average number of separations and hires for the industry group. The rate shows what percentage of the labor force is new.
- Turnover rates vary by industry cluster. Turnover rates are highest in the Hospitality, Leisure & Entertainment and Building & Construction clusters. Industries outside of Clusters have a high turnover rate as many retail businesses make up this group.
Download the full Industry Cluster report here.
Access data about targeted industry clusters in Philadelphia:
Hospitality, Leisure & Entertainment
Wood, Wood Products & Publishing
Notes on Data
Philadelphia Works followed industry cluster definitions proposed by the Center for Workforce Information & Analysis in preparing the data and reports listed above. Some industries, such as those that have a low number of jobs in Philadelphia County, were excluded from the analysis, and PA industry clusters were formed in the same way to make comparisons possible.
All the wage, employment, and staffing patterns data in this report come from the EMSI 2013.4 Class of Worker Data. EMSI industry data have various sources including the QCEW (Quarterly Census of Employment and Wages), with supplemental estimates from County Business Patterns and Current Employment Statistics. Non-QCEW employees data are based on a number of sources including QCEW, Current Employment Statistics, County Business Patterns, BEA State and Local Personal Income reports, the National Industry-Occupation Employment Matrix (NIOEM), the American Community Survey, and Railroad Retirement Board statistics.
Philadelphia Works worked with the Quarterly Workforce Indicators data available through the U.S. Census and defined the industry clusters at the four-digit NAICS code level. An industry group was assigned to a cluster if most of the employment fell in that cluster. Because the data are cyclical, the quarterly data were smoothed using a simple moving average.